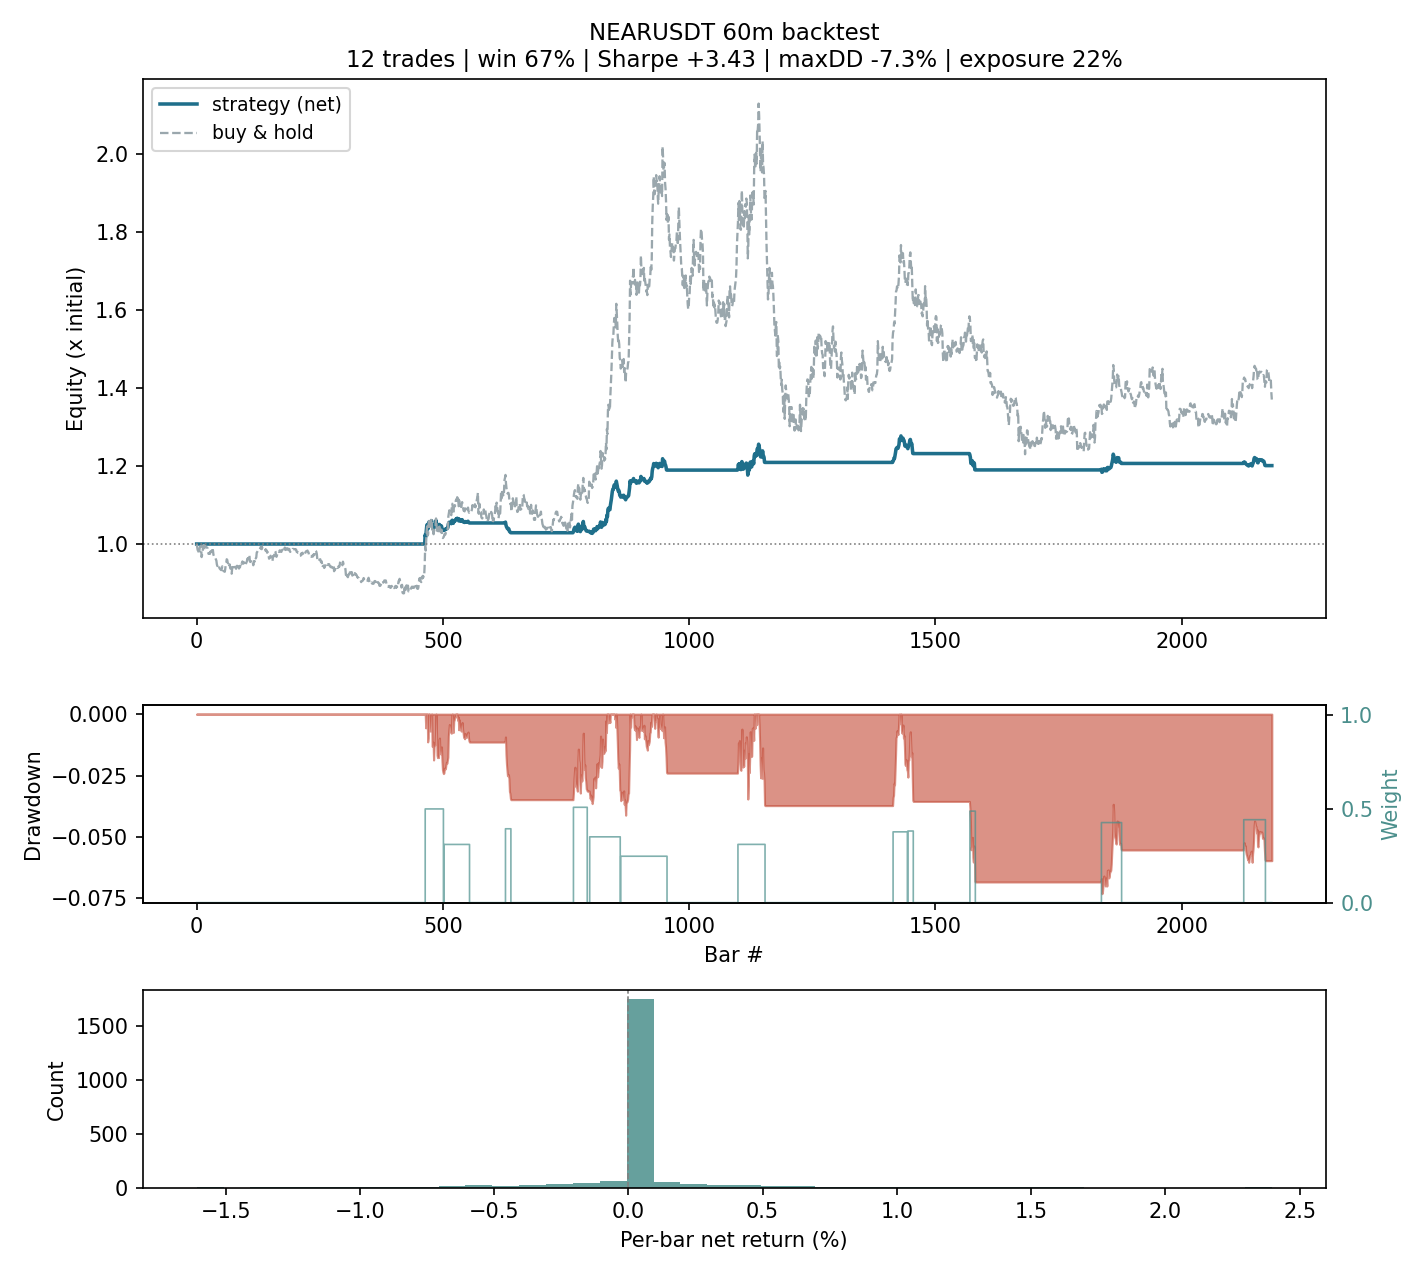
Validation discipline, not a performance claim
Read this as a worked example of honest evaluation, not as evidence that this strategy makes money. The sample is far too small to conclude anything — the most useful thing this page does is show how to see that, rather than hide it.
Setup: 91 days of real NEARUSDT 1-minute data (mid-April → mid-July 2026), aggregated to 60-minute bars, with Binance taker fees (0.10%/side) and slippage (0.02%/side) charged on every fill. Walk-forward re-optimises a deliberately small grid on rolling 30-day windows and reports only the unseen 10-day windows that follow.
| Configuration | OOS return | Sharpe | Max DD | Trades |
|---|---|---|---|---|
| v1 scalper @ 4m (the old bot) | −82.4% | — | −82.5% | 714 |
| v1 scalper @ 60m (same strategy, slower) | −9.4% | — | −17.0% | 39 |
| v2 @ 60m — walk-forward OOS | +10.7% | +2.84 | −7.5% | 38 |
| v2 @ 60m — 2× cost stress | +13.3% | +3.54 | −5.9% | 36 |
| v2 @ 60m — ETHUSDT (held-out symbol) | +5.8% | +2.15 | −7.5% | 26 |
| v2 @ 60m — SOLUSDT (held-out symbol) | +0.3% | +0.18 | −5.7% | 35 |
Read the +10.7% row together with the caveats below — on this sample it is one draw from a wide distribution, not evidence of skill. Every figure is reproducible in two commands (see Quickstart), including the ones that undercut the strategy.
The numbers above are statistically inconclusive, on purpose
- The trade count is inflated. 38 "trades" are the legs of a top-3 parameter ensemble over the same windows, so they are heavily correlated — the number of independent decisions is closer to ~13. A Sharpe of 2.84 estimated on ~13 effective, serially-dependent observations has a standard error wide enough that the 95% confidence interval comfortably contains zero.
- The 2× cost stress going up is a warning, not a win. Costs cannot improve any individual trade; the rise from +10.7% to +13.3% means the in-sample optimiser simply selected different parameters under stressed costs — a direct measurement of selection noise, reported instead of buried.
- One market phase. 91 days is a single trending regime for NEAR. ETH (+5.8%) and especially SOL (+0.3% — i.e. nothing) on the same window are the honest counter-evidence, deliberately left in.
- Buy & hold beat it on raw return (+38.2% over the same windows) with far larger drawdowns; the strategy was invested only ~30% of the time.
On the only data tested, the v1 scalper is decisively dead (−82%, a robust finding), and v2 is not distinguishable from noise at this sample size. Claiming an edge would need multi-year data, bootstrapped confidence intervals and a deflated Sharpe ratio.
The deliverable here is the machinery — and the discipline to reach that conclusion honestly — not the +10.7%.
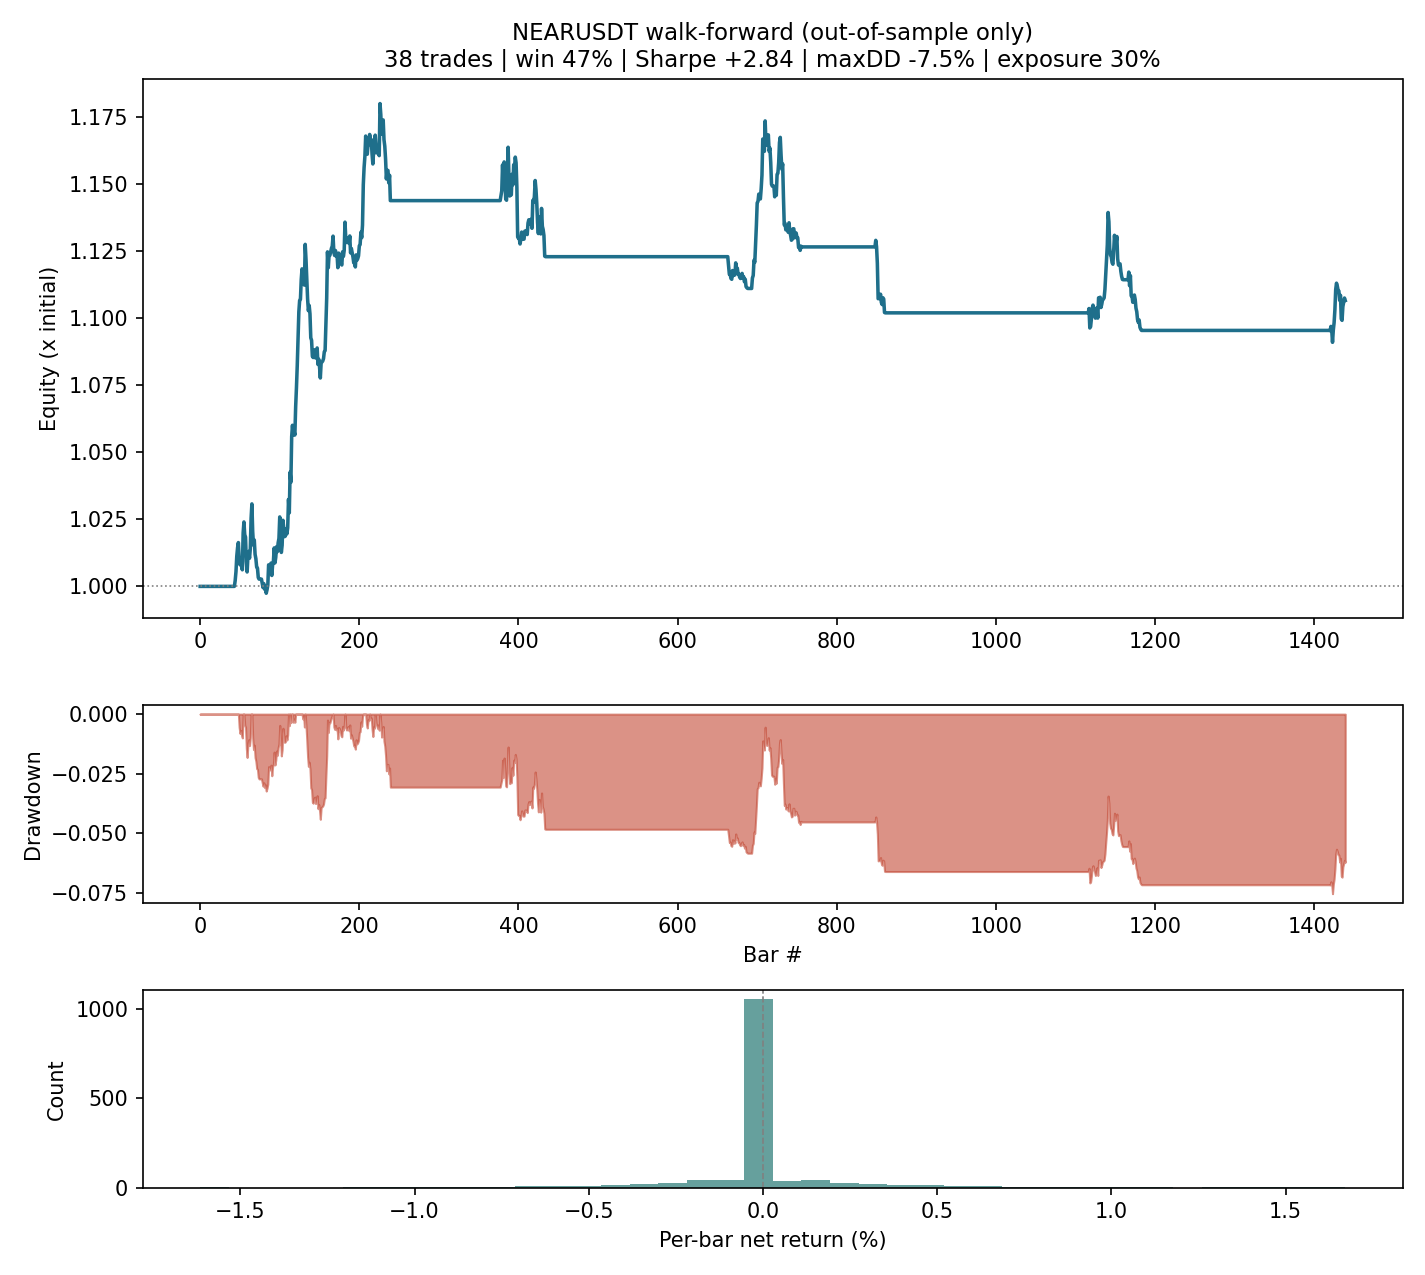
python -m near_bot walkforward --plot.